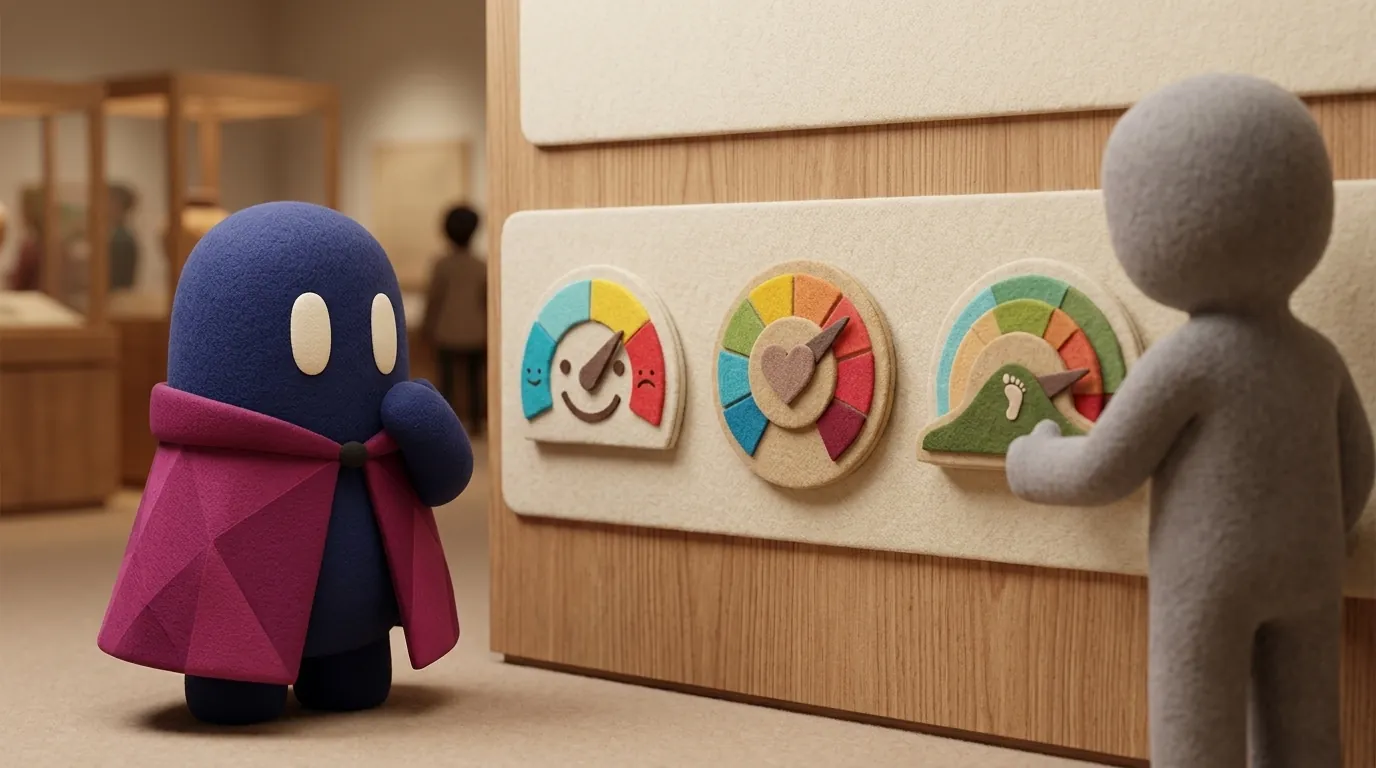
NPS, CSAT, and CES: What Each Measures and When to Use It
NPS measures loyalty, CSAT satisfaction with one interaction, and CES effort. How each is calculated, when to use it, and why they cannot be converted.
What question does each one answer?
The three look related because they all use a scale, but they ask different things. Qualtrics summarizes the difference: CSAT is more transactional and suits specific touchpoints; NPS is more relational and measures overall loyalty to the company (Qualtrics: CSAT vs. NPS).
The practical rule looks like this:
| Metric | Question it asks | What it measures | When to use it |
|---|---|---|---|
| NPS | How likely are you to recommend the company? | Loyalty to the relationship | Periodic tracking and comparison with competitors |
| CSAT | How satisfied were you with what you received? | Satisfaction with one interaction | Reviewing the quality of a touchpoint |
| CES | How easy was it to resolve your problem? | Friction in a process | Support, onboarding, returns, payments |
How is each one calculated?
NPS. Customers rate from 0 to 10 how likely they are to recommend the company. Promoters score 9 and 10, passives 7 and 8, and detractors 0 to 6. The result is the percentage of promoters minus the percentage of detractors, so it ranges from -100 to +100 (Qualtrics).
CSAT. Customers rate how satisfied they were with what they received, on a 1-to-5 scale. You count the 4 and 5 responses and divide by the total. The result is a percentage (Qualtrics).
CES. It measures the effort needed to resolve a problem. SurveyMonkey describes it as a friction metric: it captures how hard a process was, not how the person felt. The scale is mostly 1 to 7 (sometimes 1 to 5), where according to SurveyMonkey higher values mean less effort, and it is reported as a mean. The direction of the scale matters, so check which one your tool uses (SurveyMonkey: CES vs. CSAT).
The numbers are not comparable. An 80% CSAT and an NPS of 40 measure different things, even though both are written as numbers.
Where does NPS come from?
NPS came from an article by Frederick F. Reichheld of Bain & Company, published in Harvard Business Review in 2003 as “The One Number You Need to Grow”. Its premise is that companies spend heavily on complex tools to measure satisfaction and, according to the article, sometimes measure the wrong thing (HBR: The One Number You Need to Grow). A single 2003 article does not prove that NPS predicts growth in every sector. Treat it as a useful trend metric, not a universal truth.
When should you NOT use each one?
- NPS if you need to know the why. Qualtrics describes it as often contextless: it indicates overall loyalty but little else.
- CSAT to judge the whole product strategy. Qualtrics calls it narrow: customers answer only what is asked, which leaves gaps in context.
- CES if the customer’s problem is price or the product itself, not the process. A person can resolve something in two clicks and still be annoyed about what they bought.
That is why Qualtrics recommends asking for written feedback alongside the scores.
If you are taking these metrics into a specific study, the research plan should say which question each one answers before the first survey goes out.
Which combination makes sense?
SurveyMonkey offers a useful reading: high CSAT with poor CES means people are getting what they need, but the process is taxing. Good CES with low CSAT means the interaction was easy, but the outcome disappointed.
Illustrative example
Illustrative example: an appointment booking app sends a CES survey after every rescheduling and a CSAT survey after every appointment. One month, the CES for rescheduling rises from 3.1 to 4.4 on a 1-to-5 scale (where higher means less effort), but the CSAT for appointments drops. The team reads the comments and finds that the problem was not rescheduling but the quality of care on the day of the appointment. CES improved the process; CSAT pointed to a different problem. Without both metrics, the team would have celebrated one number and ignored the other.
If you want to build the study that collects these answers, start with a clear research plan. Before trusting a percentage, review research bias.
Common mistakes
- Using NPS as if it were satisfaction and deciding a screen change based on it.
- Comparing one team’s CSAT with another’s without the same question and scale.
- Converting CSAT into NPS, or adding up metrics that are calculated differently.
- Sending the survey days after the interaction: CES loses precision once the effort has been forgotten.
- Looking only at the number and not reading the comments.
What you can do tomorrow
- Write in one sentence the decision you want to make with the metric. If there is no decision, do not send the survey.
- Use CES for processes and CSAT for interactions. Use NPS only if you want to track loyalty over time.
- Add one open question to each survey to understand the reason behind the number.